
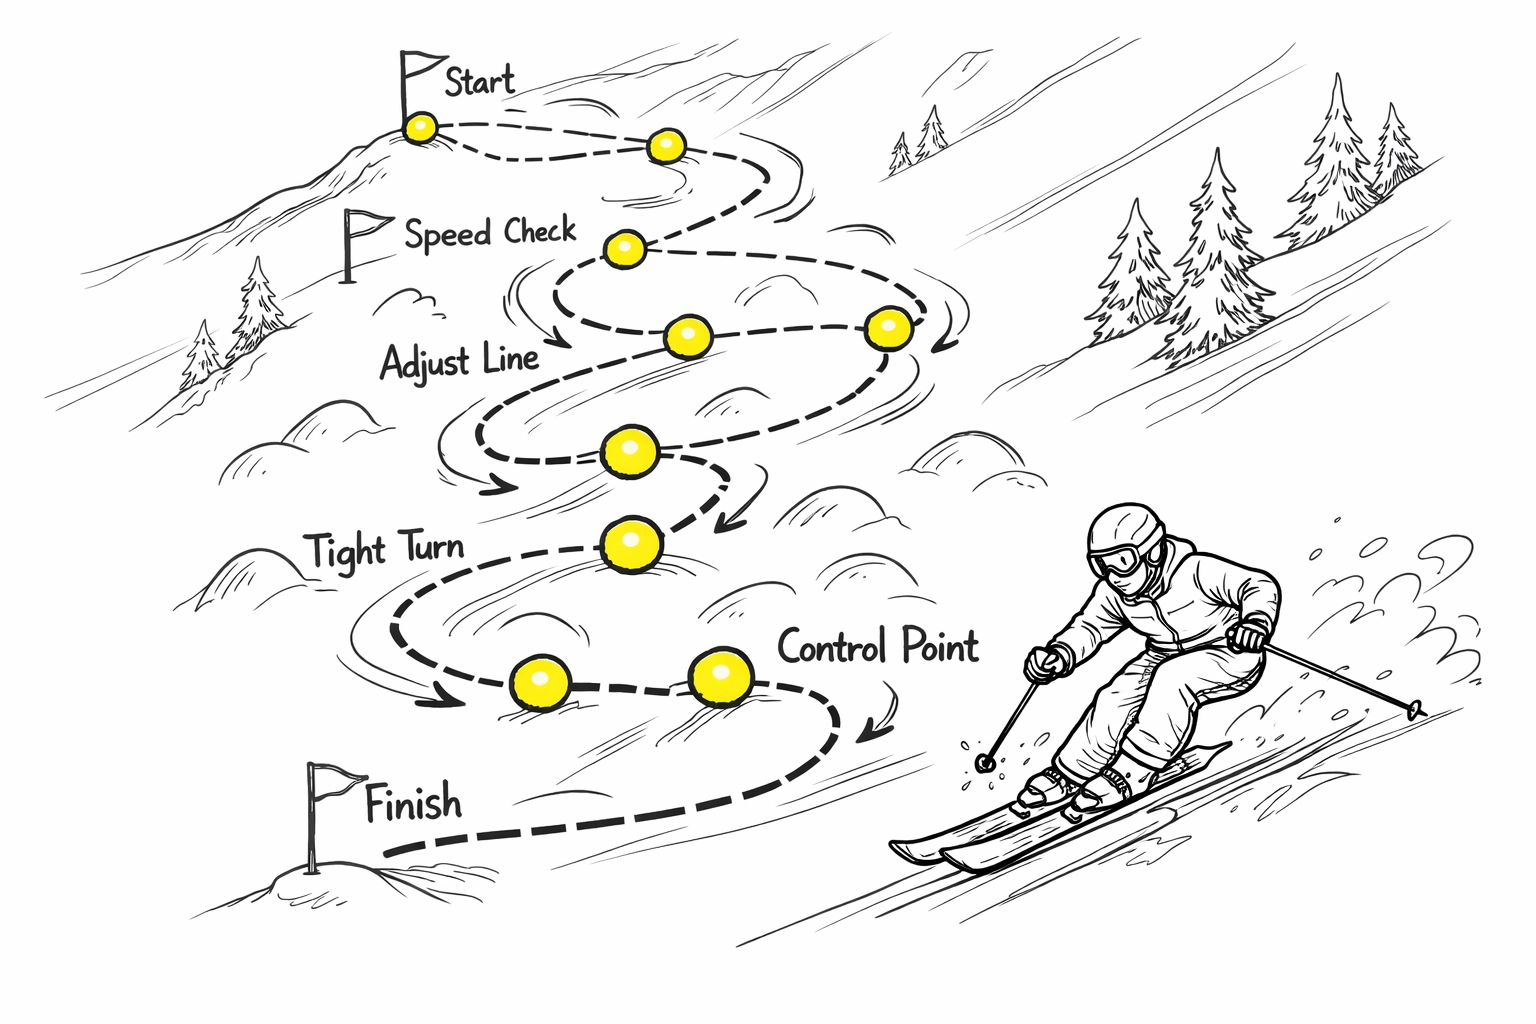
Picture this: You're a downhill skier blazing down the mountain at the Winter Olympics. Mid-run, you spot an unexpected patch of ice. Do you stick to your original line and hope for the best? Or do you adjust your weight distribution, change your angle, and carve around it?
The answer's obvious. Yet in digital marketing, businesses make the first mistake all the time, they set a strategy in January and white-knuckle it through December, ignoring every warning sign their data throws at them.
Let's fix that. Here's how to use data analytics to pivot your marketing strategy mid-season, without wiping out.
Why "Set It and Forget It" Doesn't Work Anymore
Your Q1 marketing strategy looked brilliant on paper. You mapped out campaigns, allocated budgets, and set ambitious goals. Then reality hit: a competitor launched a viral campaign, Google updated its algorithm (again), or your target audience suddenly shifted their behavior.
The market moves fast. Your strategy needs to move faster.
Olympic athletes don't train for four years with a single rigid plan. They constantly analyze performance data, adjust techniques, and recalibrate based on changing conditions. Your marketing deserves the same approach.

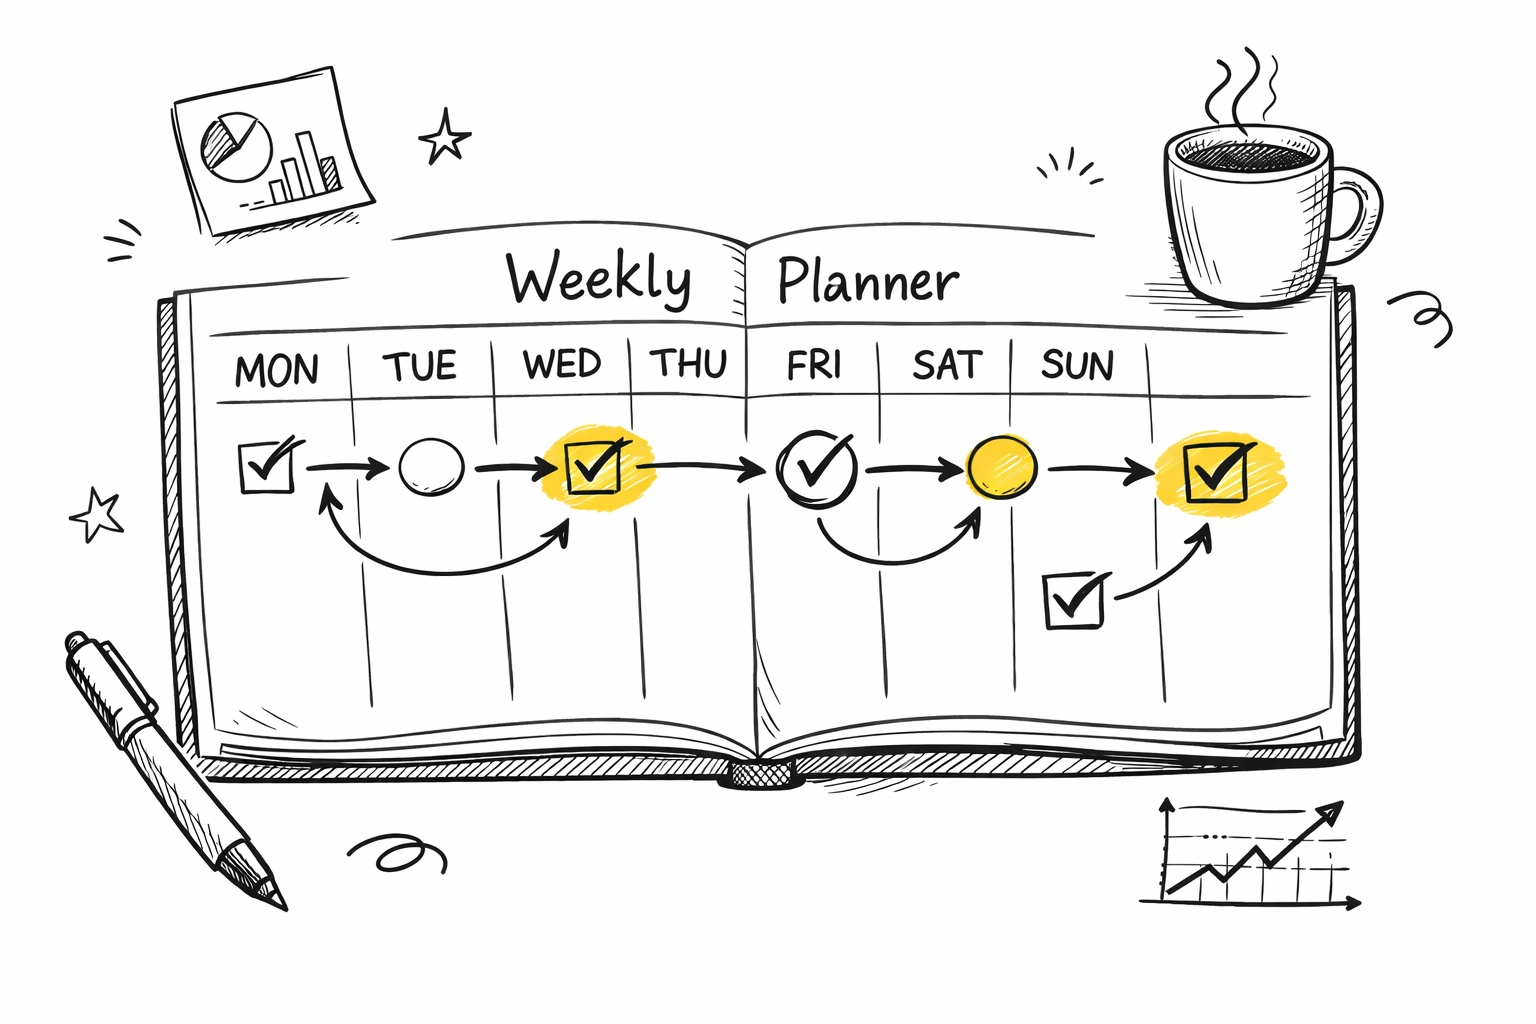
Building Your Performance Dashboard: The Essential Monitoring System
Before you can pivot effectively, you need to know where you're actually standing. Think of this as your race bib sensors, the technology that tracks every split time and speed variation.
Start with Google Analytics 4 (GA4). If you're still fumbling with GA4's interface, welcome to the club. But here's the truth: once you set up your custom dashboards, this tool becomes your best friend for mid-season adjustments.
Create a weekly monitoring dashboard that tracks:
- Traffic sources and trends – Where are your visitors actually coming from versus where you expected them to come from?
- Conversion paths – How many touchpoints before conversion, and which channels are assisting?
- Engagement rates – Time on site, pages per session, and bounce rates by channel
- Goal completions – Not just totals, but completion rates and trends week-over-week
Set up custom alerts in GA4 for significant drops or spikes. If your organic traffic suddenly plummets 30%, you want to know immediately, not three weeks later when you finally check your dashboard.
The Weekly Check-In: Your Mid-Run Course Correction
Here's where most marketers fail: they collect data but never actually look at it until quarterly reviews. That's like checking your ski time after you've already crossed the finish line, interesting, but useless for the current run.
Institute weekly data check-ins. Block 90 minutes every Monday morning (or whatever works for your schedule) to review the previous week's performance. No meetings, no distractions, just you and your data having a heart-to-heart.
During these sessions, ask yourself:
- What surprised me this week?
- What's trending up or down?
- Which campaigns are overperforming or underperforming?
- Are we on track to hit monthly goals, or do we need to adjust?
Document everything. Create a simple spreadsheet tracking week-over-week changes in your key metrics. Patterns emerge quickly when you're paying attention.
Setting Your Red Flag Thresholds
Olympic coaches don't wait for catastrophic failures. They establish clear performance benchmarks, and when an athlete falls below threshold, they investigate immediately.
Your marketing needs the same red flag protocol.
Define specific thresholds that trigger immediate action:
- Conversion rate drops 15% or more week-over-week → Investigate landing pages and user experience
- Cost per acquisition increases 25% → Review ad targeting and bidding strategies
- Email open rates fall below 18% (for your baseline) → Test new subject lines and send times
- Organic traffic declines 20% → Check for technical SEO issues or algorithm updates
The specific numbers matter less than having them documented. When a metric breaches its threshold, it automatically moves from "monitoring" to "action required."
Pro tip: Set these thresholds at levels that give you time to respond, not at panic-inducing extremes. You want early warnings, not emergency alarms.
Data Context: Don't Mistake a Mogul for a Cliff
Here's where marketers get tripped up: they see a sudden change in the data and immediately panic-pivot. But context matters.
Did your website traffic drop 30% last week? Before you overhaul your entire SEO strategy, check:
- Seasonal patterns – Did the same thing happen last year at this time?
- External factors – Was there a major holiday or industry event?
- Measurement issues – Did Google Analytics stop tracking properly? (Yes, this happens.)
- Sample size – Is this statistically significant or just normal variance?
Validate before you pivot. Olympic skiers don't change their entire technique based on one rough turn. They analyze whether it was an anomaly or a legitimate issue.
Look at data over rolling 30-day periods, not just week-to-week snapshots. Identify patterns, not just data points. And always cross-reference multiple metrics before making major strategy changes.

Making the Actual Pivot: Strategic Mid-Season Adjustments
Okay, you've identified a real issue that requires action. Now what?
Let's say your GA4 data reveals that your paid social campaigns are generating tons of clicks but almost zero conversions. Meanwhile, your organic blog content is converting at 3x the expected rate.
Option 1: Reallocate Budget – Shift 30% of your social ad spend into content amplification and SEO.
Option 2: Improve the Weak Link – Keep the social budget but overhaul your landing pages to better match social traffic intent.
Option 3: Double Down on What's Working – Pour resources into creating more blog content and building backlinks.
There's no single right answer, but here's the framework: Test small, measure quickly, scale what works.
Don't shift your entire budget overnight. Make incremental adjustments, give them 2-3 weeks to generate data, then decide whether to continue, expand, or kill the pivot.
Document every change with dates and rationale. When March's pivot affects June's results, you'll want to remember what you did and why.
Advanced Moves: Multi-Touch Attribution and Predictive Analytics
Once you've mastered basic pivoting, level up with more sophisticated tools:
Multi-touch attribution modeling in GA4 helps you understand which channels deserve credit for conversions. Maybe your Facebook ads aren't converting directly, but they're critical in the awareness stage. Cutting them could hurt your entire funnel three weeks later.
Predictive metrics (available in GA4) use machine learning to forecast which users are most likely to convert or churn. This lets you adjust targeting proactively rather than reactively.
Third-party tools like Microsoft Clarity, Hotjar, or Mixpanel provide additional layers of insight: heatmaps, session recordings, and user behavior analysis that GA4 doesn't capture.
The Post-Season Review: Learning for Next Year
When your season (or campaign) ends, conduct a thorough root-cause analysis. Olympic teams spend months reviewing race footage and performance data. You should spend at least a few hours doing the same.
What adjustments worked? Which ones flopped? What would you do differently next time?
Create templates and playbooks based on your learnings. If you discovered that email performance always dips in mid-February, bake that into next year's strategy from the start. If Instagram Reels consistently outperform static posts, adjust your content production accordingly.
Update your monitoring thresholds based on actual performance data. Your red flags should evolve as you gather more information about what "normal" looks like for your business.
Your Mid-Season Adjustment Checklist
Let's bring it home. Here's your action plan:
✅ Set up GA4 dashboards for weekly monitoring of key metrics
✅ Schedule recurring check-ins every Monday (or your preferred day)
✅ Define red flag thresholds for each critical metric
✅ Create an escalation protocol for when thresholds are breached
✅ Validate data before making major strategic shifts
✅ Test pivots incrementally rather than overhauling everything at once
✅ Document all changes with dates, rationale, and expected outcomes
✅ Conduct post-season reviews to inform future strategies
The best Olympic athletes aren't just talented: they're obsessive about data, quick to adjust, and relentless about improvement. Your marketing can be the same.
Stop skiing blindfolded. Open your eyes, watch your data, and pivot like a pro.
Want help setting up your analytics dashboard or interpreting your marketing data? Check out more resources on digital marketing best practices or reach out to our team. We love talking data (maybe a little too much).
0 Comments